
One day I was staring at OpenStreetMap and it occured to me that most streetmap renderings are optimized for vehicles: most often cars, but sometimes bikes and more rarely buses and trains.
I got to thinking about what a map would look like were it focused on the needs of pedestrians. Pedestrians navigate urban landscapes in a very different way than vehicles do, and so the function of a streetmap for a pedestrian is to quickly identify pedestrian-hostile areas (no sidewalks, or large buildings that span multiple blocks) and to locate landmarks along the way.
Although I'm far from a cartographer, OpenStreetMap provides for enough data and tooling for an interested dabbler to have some fun, so I decided to use this excuse to play with geodata and map rendering software.
The main differences from a standard streetmap rendering are:
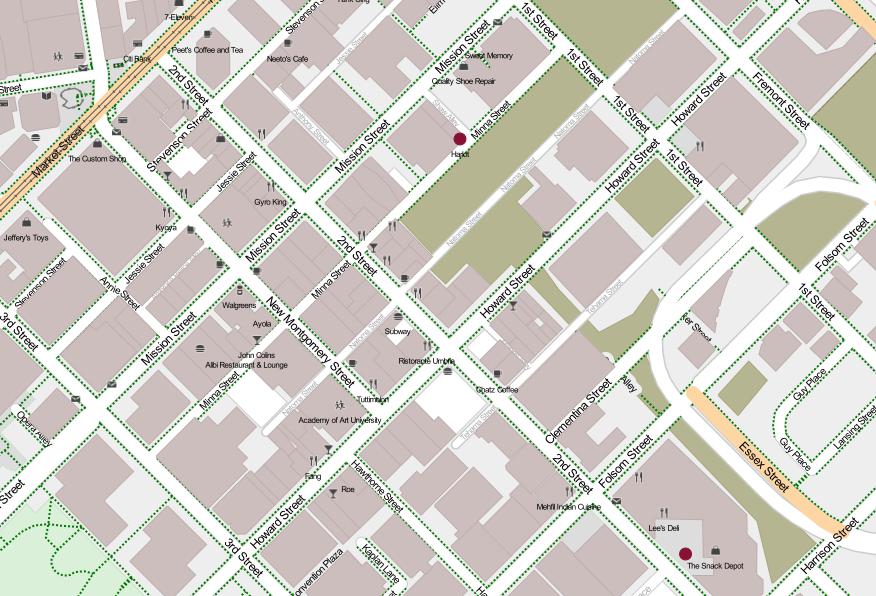
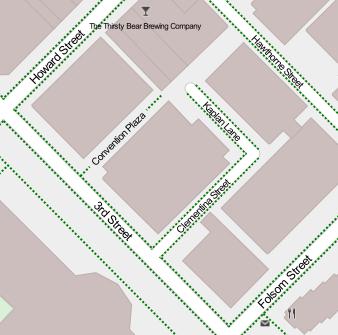
Footways are shown as green dotted lines, both when the run alongside roads and when they are independent.
Roads with no attached sidewalks at all are de-emphasized since the are useful to pedestrians only as landmarks.
Roads that have bus or tram service are highlighted in orange, since these could be considered to be "trunk routes" of the pedestrian network. (At the time I was doing this work the bus route data in San Francisco was pretty spotty, but it seems to have improved in the mean time.)
Business and amenities such as shops, restaurants, schools and churches are prioritized over pedestrian-irrelevant features like car parking facilities and one-way streets.
A subset of the map is available to browse on Mapbox, and the code repository is also available.
Building a Map

An interesting ecosystem has arisen around OpenStreetMap that makes experimenting with cartography pretty easy for a novice like myself. Mapnik is a Python library that makes it easier to build applications that produce high-quality maps. With this foundation, map-hosting company Mapbox produced a straightforward map design tool called TileMill, which was the main tool I used in this project.
TileMill accepts geodata in a variety of formats, and passes it to Mapnik along with a style definition produced with a CSS-like language called Carto.
Many large-scale users of Mapnik and TileMill make use of a PostGIS database, using Postgres to represent large amounts of geodata. My needs were more modest, so I settled on just using simple CSV files for my data layer. I wrote a simple Python script to traverse an OpenStreetMap XML export, identify the interesting features, and write them out to several different CSV files. I then imported these CSV files into TileMill in an appropriate order.
With the data imported, the remaining work was to write the Carto stylesheet to define how the data is to be rendered. Most of this was quite straightforward once I got the hang of the language, but one feature that proved particularly troublesome was sidewalks, as we shall see in the following section.
The Trouble with Sidewalks
One problem I didn't consider at first is that it is not only the default rendering of OpenStreetMap that is vehicle-centric, but in some ways the data also. In particular, streets are represented as either single polylines (in the case of a regular street) or two parallel polylines (in the case of a regular highway), which is assumed to carry two-way vehicle traffic unless defined otherwise.
Since no other OpenStreetMap rendering has cared about sidewalks, the representation of them is ill-defined and very little data seems to exist in the database in practice. In order to move forward I spent a few days surveying sidewalks in San Francisco's South of Market (SoMa) neighbourhood and updating the OpenStreetMap database with this data, but the upshot is that it's non-trivial to produce a similar pedestrian map of any other area of San Francisco, or any other city for that matter.
Since the sidewalk data is bundled into the street data, some Carto gymnastics were required to render the dotted green lines on either side of the street, and there are rendering problems where a road dead-ends and there is no way to indicate whether a sidewalk is present along the end of the street. However, I think I achieved a reasonable approximation. Were I doing this over again I'd consider drawing the sidewalks out as a separate data set in my Python script, to allow for additional post-processing on them.
Possible Future Enhancements
While I'm largely done with this project for the moment, there are some areas in which it could be improved by someone sufficiently motivated:
The map rendering (and, on the whole, the underlying data) doesn't capture the presence of crosswalk-free intersections, which can be quite troublesome when it comes to efficient pedestrian movement.
I added a special rule to render stairways in a slightly different way than flat paths, but with some more effort it should be possible to produce a useful map for pedestrians who use wheelchairs. In particular, such a map ought to contain information on where crosswalks with lowered curbs are available.
The map rendering is only tailored for a very limited range of zoom level. Since OpenStreetMap streets are just polylines, it's up to the renderer to provide a wider rendering at higher zoom levels, but I only did this up to a point.
Now that the bus data in San Francisco is more complete, it could be interesting to simply re-render the map with the updated data to get a more complete picture of which areas are covered by bus services.